Observations from Princeton, NJ
A young girl cycling to school alone crossed my path a few mornings ago. The last time I had such a sighting was in The Netherlands, but in the U.S. we have nearly wiped out this species of cyclist, children of any gender and especially girls. I would have been really startled had I seen the girl in Los Angeles, but — alas — this vision appeared to me in Princeton, New Jersey, where I have been spending the past weeks in the company of my girlfriend, who is teaching a short course at the town’s famous university.
That sighting, so unexpected at first, has since been repeated many times. In general, cycling seems to form a bigger, more visible part of transportation here in Princeton than it does in Los Angeles, a city with one-hundred times the population. Princeton enjoys some natural advantages: a small and dense historical district, relatively light traffic, polite drivers, flat terrain, and built-in demand for cycling from students of all ages. It also has something of a “factory town” feel: many university employees live nearby, and they often walk or cycle to school, including most of the professors I’ve met. The other cyclists I’ve spoken with all seem to echo similar positive feelings, that riding here is easy and safe so long as one stays off the main boulevards.
This robust cycling demand has been achieved with hardly any infrastructure. A few streets have bike lanes, and the city boasts a number of short shared-use paths. However, these accommodations all lie well outside the central business district (or they are on campus) and they are mostly not interconnected. In the downtown area, where much of the cycling I’ve seen happens, and on the immediately adjacent roads that travel through the university campus, Princeton has so far provided sharrows, those much-loathed and useless bits of paint that became popular a few years ago.
Consider Nassau Street, the main east-west boulevard of Princeton. On its south side lies the university, and on its north side the town. At its intersection with Witherspoon Avenue lies the heart of the community. From there, shops and restaurants line its sidewalks from Mercer Street on the west to Harrison Street on the east, a total distance of about one mile.
Residents and tourists throng Nassau’s sidewalks and vehicles swarm its asphalt. Nassau also functions as an alternate through-route for travelers from Trenton to Edison, large commercial vehicles frequent it. Nassau works as a do-all road for business and leisure, and locals find it inescapable in their daily lives. Angelenos might think of it as the rough equivalent of Wilshire Boulevard, at least in terms of city impact.
If you want to cycle on Nassau you have two choices: you can ride on the street and hope drivers pay attention to you and the sharrows, or you can ride on the sidewalk. Neither option is great, for unlike Los Angeles, the sidewalks aren’t empty, and like Los Angeles, the roadway is packed. In my anecdotal observations, most cyclists choose the sidewalk. In one rather memorable moment, I saw a mother pedaling one child on her bicycle, and shepherding a second child on a bicycle of her own; the pair negotiated a complicated set of turns to pass from the sidewalk on one side of Nassau to the opposite. I saw this pattern repeated often with many sorts of riders. It was obvious to me, and perhaps to any observer, that what Nassau needs is a cycle track: it has the current cycling volume to justify it and the motor vehicle danger to demand it.
Over the past year or two, Princeton has been working on a major revision of its vision for cycling infrastructure. Its 128-page “Bicycle Master Plan,” released last June, would bring many improvements to cycling facilities if implemented. The plan is at once encouraging in its message and disappointing in its scope, perhaps reflecting the usual political difficulties in remaking streets. Nassau Street is slated to receive a cycle track (yay!), but only for about half of what it should have (boo!), from about Mercer Street to Washington Road, and not continuing organically to Harrison Street, where the central business district ends. The missing half of the cycle track will instead receive a treatment new to me, the “enhanced sharrow,” which in diagram 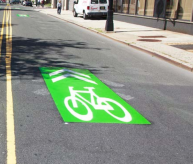 looks like a sharrow with a green box around it, making it cost twice as much for probably the same effect. I believe the cycle track wasn’t extended here because it would mean removing parking, every community’s favorite political hot potato. The half of the street getting the cycle track is much wider, easier to divide, and the proposal also relies on Princeton University ceding a right-of-way. All this aside, the cycle track comes in two options, one with a two-way lane on the university side of the street, and the other with lanes on each side. To my eyes, the two-way lane proposal is the obviously inferior option: it excludes cyclists from the shops and restaurants across the street, effectively making the path a short cross-town expressway. However, this option preserves more parking, and in parking’s hot potato way, will probably appeal more to politicians.
The Princeton Master Plan has many such half measures and compromises. Busy Washington Road, which splits the campus in half, spirits drivers south from town to Route 1, and scores of students are put into danger daily passing from one side to the other. In the best of worlds, it should be blocked off from Nassau Street to Faculty Road during school hours, though I’m sure that will never happen; the town couldn’t even bring itself to block it during a big regatta held on Lake Carnegie last Sunday, with hundreds of people clustered alongside the road watching the rowing. Meanwhile, the Master Plan gives Washington the same half-and-half treatment as Nassau, sharrows for part of it and a buffered bike lane for the other. Harrison Street, where we have been living, is a major throughway connecting important roads in the north and south, and a miserable road for cycling (and walking, with sidewalks only on one side). It receives similar treatment as Nassau, with half of it getting a cycle track and the rest enhanced sharrows.
However, lest I sound too negative on the plan, it might make cycling safer and better, and in any case, represents a start for future enhancements. If cyclists respond to it, perhaps politicians will have reason to install the halves missed this time. We cyclists often are forced to take what we can get, and all-in-all, the getting here isn’t half bad.
A week ago Thursday, I took the opportunity to attend a meeting of the Princeton Bicycle Advisory Committee. I’ve never attended such a meeting before, but I’m guessing that many of the concerns the thoughtful and committed members expressed can be heard at any such meeting, no matter the city’s size. The committee was concerned about progress on the Master Plan, for since June the mayor’s office has been occupied with other issues, and plan momentum has stalled. It was also studying the feasibility of running a ciclovía, Bogotá style, with funding issues dominating the discussion. It brought in an expert in traffic counting to talk about counting cyclists and pedestrians in Princeton, which is something Los Angeles should have done years ago, and every smart city should do. As he put it, “If you don’t count, you don’t count.”
Princeton is poised on the cusp of a cycling revolution if it wants it. The natural demand for cycling, plus the latent demand that would likely be exposed with quality infrastructure, could easily give it Dutch mode-share levels. I haven’t had enough time here to understand any of the town’s political machinations — though, as it turns out, one of my college classmates is the mayor — but I’m sure some array of community scions and burghers are allied against parts of the Master Plan. On the other hand, cycling does seem to have at least some business support; two weeks ago, the town’s nearby mall, Princeton Shopping Center, installed a Zagster bike-share rack on its own volition (!); it purchased the rack and bicycles privately, and set it up to connect to the university’s network. If cycling has a chance anywhere, it has it here. I’ll be interested to see how they progress.
Quitting, the most difficult decision
Should I quit cycle-commuting? I’ve been mulling over this question for the past month during my daily round-trip from Silver Lake to Century City. I’m not alone in these musings; I’ve since read two recent accounts of other cyclists dismounting for good. Cycling’s dangers and indignities have become the primary, even sole, deciding factors in these cases and mine.
Before taking up bicycle commuting about two years ago, I walked to work in Century City. For eighteen years I really looked forward to those walks, bookends to my workdays. To be sure, I had scary experiences as a pedestrian, perhaps one per month. I used to joke that I would die at the intersection of Santa Monica Boulevard and Century Park East, where hurried drivers would zoom past me in the crosswalk. Once I started cycling to work, however, the frequency of these terrifying experiences has skyrocketed. It’s no longer once monthly, but closer to once or twice daily. The number of intersections in which I can joke about dying has increased manifold. I don’t look forward to my commutes anymore. I’ve stopped joking, I now have nightmares.
Prepping for my commute is almost a religious ceremony. I pull on a breastplate, a high-visibility vest. I don a prayer cap, a helmet. I anoint my face with a pollution mask, and I gird myself with gloves. I light talismanic candles, bright and blinking lights totaling thousands of lumens to protect my journey. I wheel my bicycle into the street, say a little prayer, and then commit my spirit into the mercurial hands of driverdom.
Around seventy cyclists die annually in Southern California, over one per week. Ted Rogers of bikinginla.com keeps the statistics, gleaned from news accounts and emails from riders. Official statistics from SWITRS come years behind and aren’t complete, but they usually show that cyclists are killed in numbers in excess to their share on the road. No one keeps good statistics on injuries, but once in awhile a researcher will write a paper about hospital admissions; the results aren’t encouraging.
I often read these grim numbers to understand how I can avoid being one of them. Somehow it helps if I can distinguish the kind of riding I do from the riding that “they do.” If this rider was killed riding at 2:30 AM, I can breathe a little easier, for I don’t ride in the wee hours. If that rider was killed while riding against traffic, I remind myself that I don’t salmon. However, more often than not, I can’t shake the increasingly obvious fact that deaths and injuries happen frequently, randomly, and unpredictably, no matter what sort of choice I make about when, how, or where to ride.
Is cycling in traffic safe? I can find statistical support for any answer I want: yes, no, who knows. My own experiences suggest the answer should be no, not safe. In 2009 I was rear-ended while riding on Los Feliz Boulevard; last year I was brushed (side-swiped) on Fountain Avenue. I can recount several other close passes, terrifying moments — the usual stuff that you will hear from almost any cyclist. I shrugged off these experiences when they happened, but they still haunt me. They’ve also made me into a poor advocate; I cannot argue for cycling’s essential safety, I am a personal testament to its dangers. As much as I want to believe the opposite, little by little I’ve had to admit to myself that I don’t feel safe on the road. I never feel safe out there.
At least three possible antidotes present themselves: bike trains, vehicular cycling, and improved infrastructure. Can any of them solve my safety concerns? Bike trains test the theory that riders are safer in numbers. They’ve been on the scene in Los Angeles for a few years now. I haven’t used or studied them, and I don’t know how successful they’ve been. I’d try a train if I could find one going my way, but ultimately I believe they have limited usefulness: they typically run only one day a week, only one-way, and they are routed on roads busier than I like to ride.
In a similar vein, vehicular cycling (VC) provides some useful techniques for situations in which I have few other choices. However, my experience with VC riding hasn’t shown promise: the two crashes I’ve had with cars happened when I was riding VC-style, in the manner that proponents would say is safest. More fundamentally, I’ve yet to understand how VC techniques make cycling safer. I get that they dictate a set of normalized behaviors, which if everyone followed would improve the experience of cyclists. What I don’t understand is what fundamental constraints (aside from law) ensure motorist cooperation. Sharrows, for example, are city-approved VC principles in paint; their (non) “efficacy” at informing and controlling motorists can be illustrated with two recent incidents in Corona del Mar and Toronto, Ontario. In both cases, cyclists riding down sharrowed streets found themselves in unpleasant altercations with drivers.
Infrastructure improvements would change my experience completely. My cycling trips to The Netherlands and Denmark showed me that. But Los Angeles’ 2012 Bicycle Master Plan envisions no improvements in my area. It does not even add bicycle lanes, those sirens of infrastructure, which are better than nothing but not exactly great. When the Beverly Hills City Council shot down lanes along Santa Monica Boulevard in 2014 citing safety concerns, I wasn’t very happy about it, but they may have been right. I frequently find myself unpleasantly boxed in between buses and car doors while riding the West Hollywood lanes along Santa Monica Boulevard. It’s really too bad neither city considered cycle tracks.
More generally — and contrary to the conventional narrative — cycling is not enjoying robust growth in this country, much of it probably due to safety concerns. Bicycle sales have declined for over a decade; last year, cars actually outsold bicycles by about 70,000 units. Similarly, “…on a per capita basis, half of American cyclists have quit riding bikes in the past 20 years.“ Membership in USA Cycling has fallen off since 2012, in part because the “general increase of risk aversion in society … carries over to sports [with] greater risks like cycling.” The mean age of USA Cycling members in 2013 was 39 years-old, and young cyclists have all but disappeared, both at school and on the race course. One parent told me asking her children to cycle to school would be child abuse. The cyclists that remain are turning to off-road disciplines like mountain biking and cyclecross, with at least one bike shop owner attributing the trend to safety issues. While cycling clubs are said to be bursting with members, I see this growth partly as evidence of cyclists looking for safety in numbers.
I am fortunate to have a great car, reliable and comfortable, and I can afford it. Some people will remind me that cars aren’t exactly safe, though I think that perspective misses the mark. My driving commute happens at roughly the same speeds as my cycling commute; I can assure you that driving at fifteen miles per hour is vastly safer than cycling at the same speed. I’ve been in two fender benders in thirty years of driving; there are no fender-benders in cycling, only road rash and worse. When I “fight traffic” in a car, I am mostly describing getting to my destination as quickly as possible; on a bike, fighting traffic is about staying alive. Driving is easy compared to cycling, and in fact too easy: I cannot imagine how I’d go about texting while cycling, but it’s so simple in a car that everyone does it.
I really don’t want to quit cycling. I feel better physically and mentally after a ride. I love the exercise, the wind in my hair, the sun on my back, the quiet whirr of my chain and the bicycle tires against pavement. I love almost everything about it except for the damned cars. I don’t want to give it up. I don’t know how much longer I can responsibly hold on.
The end of the pollution argument
Urban cycling advocacy is about to lose one of its biggest arguments for increased riding. For years, advocacy has relied on the idea that cycling mitigates three problems: pollution, public health, and traffic. But the handwriting is on the wall for the pollution argument, in my estimation the most compelling of the three, the one that often makes politicians sit up and notice. Consider these trends:
- 2017 may be the tipping point for the battery electric car, with at least two models breaking the 200-mile range mark and selling for prices the mid-to-upper-middle class can afford. Also, almost all car makers are adding plug-in models, even status marques like the Mercedes S-Class, Porsche, and Ferrari.
- The electrical power sector — the source of power for all these electric cars — is now cleaner than the transportation sector for the first time since 1979, cracking open the long-tailpipe argument.
- Improved technology and cheaper prices for renewables are accelerating the trend towards cleaner and cheaper power. Solar has reached grid-parity wholesale rates in sunny climes. Oregon’s mandate for fifty-percent renewables by 2030 will barely raise electricity prices to consumers. Germany occasionally has to pay people to use wind and solar power.
- With electric cars getting cleaner, cycling may actually pollute more than driving under certain conditions.
Now, it’s true that the full impact of these trends won’t be felt for years, even decades. Electric cars now account for less than one-percent of overall sales, and renewable electric generation still comes in less than fifteen-percent of total production. But if history is any guide, politicians looking for excuses not to support cycling will find them where they can. For instance, the City of Beverly Hills is betting on a fleet of self-driving cars to solve the subway’s last-mile problem, even though such technology is still in development, and may not happen for as long as thirty years, and against arguments that the bicycle solves the last-mile problem cheaply. Similarly, I expect we’ll soon hear of politicians dismissing cycling’s ability to clean up our air, given how fast the car is approaching parity.
Cycling advocacy still has many arrows in its quiver. In any case, the loss of the pollution argument will also mean winning on the issue of cleaner cities, an improvement all around. But when our best arguments now often give us gains measured in signs and paint, we need to find other compelling reasons for city action. Will traffic congestion be enough? Is public health enough? Will other arguments for cycling infrastructure — like complete streets, vision zero, and quality of life improvements — be enough?
Amsterdam cyclists ride fastest
Does cycling-specific infrastructure slow you down? Can you ride faster on streets than on bicycle paths?
Some cyclists, many of whom seem to be of the vehicular persuasion, argue this point vociferously. John Forester may have been the first, with this pip from 2001 (among others):
The bikeway advocates are so imbued with the imagined virtues of the Dutch bikeway system, that it makes cycling safe for the incompetent and creates many cyclists where there were few before, that they have transformed, in their own minds, the defects of the Dutch system, its slow speed and long delays, into virtues.
The argument has stuck around even into this, the year of our lord 2015, the supposed year of hoverboards and powered shoelaces. That such myths and inanities persist probably has much to do with lack of experience; apparently, most cyclists in the U.S., for instance, have never ridden in a place with real bicycle infrastructure. Even John Forester, critic-in-chief of Amsterdam-style bicycle lanes, never visited the country.
Enter Strava data:

Riders in Amsterdam, that city criss-crossed by bicycle lanes and infrastructure, enjoy the fastest average speed (15.9 mph) of any major city that Strava tracks. For quick comparison, here are a few other cities:
- Los Angeles: 13.1 mph
- San Francisco: 12.9 mph
- New York City: 13.5 mph
To be sure, Strava results are easy to criticize for their reliance on data-hungry, athletic riders, those who belong to a demographic that can afford and use the devices Strava requires. (I find the service helpful for tracking times and distances of my daily commute and weekend rides.) However, comparing Strava riders city-to-city has a big advantage: Strava users look similar to each other worldwide, making comparisons easy. The point? Athletic Strava users — that category of fast, competent riders that Forester liked to describe — ride faster on Amsterdam cycling infrastructure than on any type of other (mostly non-cycling) infrastructure in major cities around the world. It’s time to retire the myth that cycling infrastructure slows you down.
Why not bicycle at bicycle speeds, instead of driving at bicycle speeds?
How fast do you drive? I don’t mean to ask how fast have you driven, or how fast you wish (or think) you drive, or what the speed limit is. Instead, I want to ask how fast you drive, door-to-door, on the drives the make up your daily life.
My car has a computer that tells me my average speed for every trip. A trip starts when I start the car, and stops when I turn it off. I wonder if people would think differently about driving if all cars had a computer like this.
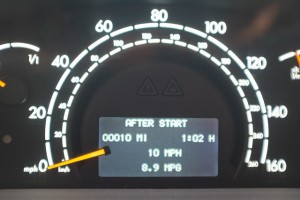
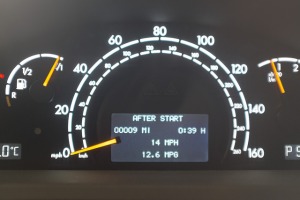
These photos are from my car’s dashboard. The photo on the left shows my commute on one Friday afternoon when I left my office at 4PM and drove the usual route home, about ten miles. It took me about sixty-two minutes; I averaged about ten miles-per-hour. The photo on the right shows a more spritely commute, the following Monday morning going the opposite way, when I was able to average about fourteen miles-per-hour. These times and speeds are normal, in customary city traffic between Century City and Silverlake.
(And yes, my car is a fuel hog. Most big cars you see around town are.)
I asked my girlfriend awhile back how fast she thinks she drives on city streets. She said she drives the speed limit, about thirty-five miles-per-hour. When we actually calculated her average speed from drive time and distance, we ended up with something closer to my computer readouts.
The fact is that when we drive in town, we mostly drive at bicycle speeds (on average). Most of us don’t have this fact staring in our faces everyday. But maybe more people would rethink cycling if they realized they are almost always driving at bicycle speeds already. If you’re already going at bicycle speeds, why not make it formal, get out of the car, get some fresh air and exercise, and bicycle instead?
The powers behind Los Angeles’s new Mobility Plan probably weren’t making this calculus explicitly. However, the constant predictions of city growth, combined with the hard facts that we have no more space for new streets, should make anyone with some sense of the inevitable look around for viable alternatives for using our streets more efficiently. Predictions of doom and gloom coming from short-sighted detractors miss the point: our traffic is already driving at bicycle speeds. We can’t really slow it down much more than it already is. Safe bicycle lanes just facilitate different kinds of traffic at the same average speeds at the rest of it, and bring lots of other benefits beyond.
Will Milt Olin ever become a statistic?
Milt Olin died on December 8, 2013 after an L.A. County sheriff struck him from behind. The sheriff was operating a computer while driving, and faced no charges. The sheriff’s department has since revised its operating procedures to limit deputies from driving while typing.
For nearly a year now, I’ve been monitoring the SWITRS data feeds in hopes of seeing how Olin’s death gets entered into the official record. As of today, nearly twenty-one months from the date he died, I still can’t find it. The SWITRS website includes a disclaimer that “data is typically seven months behind the current date” because of processing backlogs. It may be that SWITRS has yet to release its full 2013 records, but the CHP appears to have prepared its 2013 crash reports. For the CHP at least, and for the agencies and government officials that depend on CHP reports, Milt Olin’s death may never serve even the simplest function in improving roads, that of knowing who we kill and why.
A 2011 paper that looked at San Francisco hospital admissions versus SWITRS reports showed as much as twenty-six percent of cycling injuries never hit the official records. How many deaths do we miss as well?
One small step: Beverly Hills improves Santa Monica and Wilshire
The westbound intersection at Santa Monica and Wilshire Boulevard in Beverly Hills is the worst on my ten-mile bicycle commute. It has no crosswalks on its northern side, and its two right-turn lanes from Santa Monica onto Wilshire make it difficult for cyclists going straight on Santa Monica. For years, such cyclists have had to position themselves in the middle of a cacophony of cars. Here’s how it looks on Google Maps:

All these problems changed this morning. Overnight, the city removed the optional right-hand turn lane and replaced it with space off-limits to motorists. The change is most likely due to the city moving the westbound bus stop from the west side of Santa Monica to the east, requiring that buses have a way of getting back into Santa Monica traffic. That was difficult when there were two right-turn lanes to Wilshire. Now, with a single right-hand lane, the buses can navigate easier.
For me, this means the single most dangerous intersection on my commute has been removed. That wide space on the first photo below, marked by chevrons, is now space where cyclists can stop can breathe a moment.
1) Looking west on Santa Monica Boulevard. Where I’m photographing used to be an optional right turn lane.

2) Looking east from the other side of the intersection, a bus navigates back into traffic after picking up passengers

3) After the bus has left the intersection.

Who’s Dying on California’s Roads?
From 2001 until 2012, the years for which we have full SWITRS data, deaths on California’s roadways have gone from 3,926 to 2,995, a decline of about twenty-four percent. This is the good news. In 2013, a year for which full data isn’t yet delivered, deaths are already running higher than the previous year, at 3,102. The last four years have actually brought much of the same, with gradual year-over-year increases. Before that, deaths had been falling sharply, from 2007 to 2010, perhaps because high fuel prices and the “Great Recession” kept drivers off the roads.
These overall road safety gains have mostly accrued to drivers of motor vehicles, and specifically to drivers of cars and pickups. Vulnerable road users have seen few safety gains at all. Deaths among motorcyclists have risen an astonishing fifty-two percent (295 to 449), and cycling deaths by twenty-six percent (116 to 147). Pedestrian deaths look flat, down by nearly three percent (721 to 701) for the same period, but 2013 is going to be bad for them, according to the preliminary numbers I’ve seen, with 752 total deaths already reported, erasing all gains.
The stats above suffer from one big problem: they don’t have a base rate, they don’t show us per-capita changes. If motorcycle riding increased by fifty-two percent over the years from 2001 to 2012, then the increase in deaths might explainable. I haven’t spent time (on this lazy Sunday) locating base rates, if it’s even possible. But there is one easy way to use this raw data as is to show how savagely vulnerable users have suffered. We can look at the proportion of deaths each category of road user represents, per year, and look at the changes year-over-year.
Here are the proportion of deaths for all major road user categories for the years 2001-2012:
| Year | Car & Pickup Occupants | Motorcyclists | Cyclists | Pedestrians | Others |
| 2001 | 68.9% | 7.5% | 3.0% | 18.4% | 2.2% |
| 2002 | 68.5% | 7.8% | 2.1% | 10.5% | 11.1% |
| 2003 | 67.7% | 8.7% | 2.6% | 15.0% | 6.1% |
| 2004 | 61.4% | 8.5% | 3.0% | 16.5% | 10.6% |
| 2005 | 61.1% | 9.4% | 3.0% | 17.1% | 9.4% |
| 2006 | 59.3% | 10.3% | 3.7% | 17.3% | 9.4% |
| 2007 | 60.5% | 11.7% | 3.1% | 16.7% | 7.9% |
| 2008 | 56.7% | 15.6% | 3.7% | 18.4% | 5.7% |
| 2009 | 60.5% | 12.4% | 3.4% | 19.3% | 4.4% |
| 2010 | 58.3% | 12.7% | 4.0% | 22.7% | 2.2% |
| 2011 | 55.0% | 14.7% | 4.9% | 23.1% | 2.3% |
| 2012 | 54.9% | 15.0% | 4.9% | 23.4% | 1.8% |
The motorcyclist death-rate proportion increase is horrible, one-hundred percent (7.5 to 15), but every other vulnerable road user has also seen huge changes. Cyclists proportion of deaths has increased by sixty-three percent, and the proportion of pedestrians dying has increased by twenty-seven percent. Motorists, by contrast, are the sole road users showing a decrease, about twenty percent overall.
I haven’t done the hard work necessary to explain these numbers, but I’d guess car manufacturers are responsible for most of it. That is, fewer people are dying in cars because cars have gotten safer, while vulnerable users have seen no safety improvements. These users need changes in infrastructure and the laws for their safety, and we — our society and government — have done little with our roads or legislation. We haven’t lowered speed limits, improved pavements, bettered sidewalks or bicycle paths or crosswalks, tightened drunk driving standards, or enforced mobile phone restrictions. We’ve done hardly anything. The stats show up the problems: road users who have no access to better automobile technology are dying in ever greater proportions.
Safest day to cycle?
Here’s a count of all cycling fatalities in California from 2001 to 2012, tabulated by year and day of week. The raw data comes from SWITRS.
| Monday | Tuesday | Wednesday | Thursday | Friday | Saturday | Sunday | |
| 2001 | 10 | 17 | 18 | 21 | 20 | 21 | 14 |
| 2002 | 16 | 16 | 15 | 19 | 26 | 15 | 13 |
| 2003 | 19 | 19 | 15 | 20 | 19 | 18 | 15 |
| 2004 | 17 | 11 | 13 | 20 | 12 | 17 | 34 |
| 2005 | 16 | 21 | 16 | 18 | 18 | 20 | 23 |
| 2006 | 17 | 20 | 22 | 23 | 28 | 22 | 23 |
| 2007 | 14 | 21 | 23 | 17 | 15 | 21 | 14 |
| 2008 | 16 | 19 | 23 | 16 | 20 | 11 | 26 |
| 2009 | 18 | 13 | 18 | 7 | 22 | 15 | 16 |
| 2010 | 22 | 8 | 10 | 19 | 18 | 14 | 20 |
| 2011 | 21 | 14 | 23 | 15 | 22 | 29 | 18 |
| 2012 | 21 | 16 | 23 | 26 | 28 | 22 | 16 |
| Totals | 207 | 195 | 219 | 221 | 248 | 225 | 232 |
Is there any knowledge to be gleaned here about the safest day to cycle? One of the biggest problems in analyzing SWITRS cycling data comes from the lack of base rates, or overall counts of cyclists for a given period. The single worst day came from the 34 people who died on Sundays in 2004, but without knowing whether many people were cycling on Sundays in 2004, we can’t determine the rate of fatalities, and there’s not much we can derive about safety from these numbers. In a word, then, we don’t know when it’s safest to ride.
Still, my guess is that cycling rates climb on the weekends. If that’s true, we should expect to see higher fatalities overall on Saturdays and Sundays. They don’t show here in the totals for the weekends, which look rather like the rest of the week. The cause could be as simple as less car traffic on the weekends, or as rich and complex as this notion of safety in numbers, the idea that so many people are cycling on the weekends that drivers notice them.
Ultimately, we really need better information about cycling in California. We don’t know much about ourselves, how many of us ride, when we do, how we get into crashes, and why.
Helmets: Are bad stats leading to bad bills?
California state senator Carol Liu introduced an all-ages bicycle helmet bill yesterday, much to the dismay of many people who know a thing or two about helmet legislation. The early betting has the bill dying quickly in committee or elsewhere, although in a sense it might be productive to have a full and lively hearing about the merits of bicycle helmets. Some of the dismal, even disastrous, examples from places like Australia and New Zealand — where helmet legislation has apparently had no safety effect while also reducing cycling significantly — might kill these ideas for years to come.
Senator Liu’s press release included this statistical “gem” taken from a report by the National Conference of State Legislatures (NCSL): “Ninety-one percent of bicyclists killed in 2009 reportedly were not wearing helmets.” Since she mentioned it, Senator Liu is apparently relying in some part on this number to make her case. Where does it come from? Does it hold up to scrutiny? Does it reflect the California experience?
The underlying NCSL report doesn’t mention sources, but it’s a pretty safe bet that its numbers are coming from FARS, the federal Fatality Analysis Reporting System. FARS, in turn, gets its data directly from state highway data collection systems, which are implemented at the local law enforcement level. In California, the Statewide Integrated Traffic Records System (SWITRS) plays that role, and its data is open to all comers — including me, as it happens.
Over the past few weeks, I’ve been toying with SWITRS data, trying to understand its structure, and looking into what it might reveal about our roads. I’ve only gotten my feet wet with it so far, and I’ve much to learn, but from what I’ve seen, Liu’s “ninety-one percent” number is problematic. Take the year 2009, the year she singles out for mention. FARS shows 628 total cyclists killed in the U.S. that year. SWITRS tells me that 107 California cyclists were killed in the same year; presumably, those 107 are included in the 628 total. How many of those killed California cyclists were wearing helmets? SWITRS tells me there were twenty-two cyclists wearing helmets, sixty-seven who weren’t, and eighteen unknowns. In other words, in California sixty-three percent didn’t wear helmets — not ninety-one percent, as the nationwide number suggests — twenty-one percent wore them, and for seventeen percent of cycling fatalities we have no data.
My point might be small, but it should be in the mix nonetheless: Senator Liu implies that only eight percent of killed cyclists are wearing helmets, but in California that’s just not the case. More than double the cyclists are wearing them, and even more might be, if we knew more about those many unknowns. The hard facts? Lots of Californian cyclists are being killed despite their helmets, just as other studies show. We need to spend time confronting the real factors, like bad road design, high speed limits, and poor cycling infrastructure if we expect to make a real dent in fatalities.
Where does FARS get that huge ninety-one percent number? I’m not sure yet, but it sure looks suspiciously like they are grouping the unknowns in with the nos. That is a big no-no!
Just for completeness, I went back and extracted the numbers for all the years for which we have full SWITRS data (2001-2012):
| Year | No Helmet | Helmet | Unknown | No helmet | Helmet | Unknown | ||
| 2001 | 76 | 17 | 23 | 116 | 66% | 15% | 20% | |
| 2002 | 78 | 22 | 15 | 115 | 68% | 19% | 13% | |
| 2003 | 81 | 27 | 18 | 126 | 64% | 21% | 14% | |
| 2004 | 74 | 27 | 22 | 123 | 60% | 22% | 18% | |
| 2005 | 75 | 20 | 37 | 132 | 57% | 15% | 28% | |
| 2006 | 100 | 34 | 21 | 155 | 65% | 22% | 14% | |
| 2007 | 76 | 25 | 23 | 124 | 61% | 20% | 19% | |
| 2008 | 73 | 30 | 27 | 130 | 56% | 23% | 21% | |
| 2009 | 67 | 22 | 18 | 107 | 63% | 21% | 17% | |
| 2010 | 67 | 24 | 20 | 111 | 60% | 22% | 18% | |
| 2011 | 81 | 33 | 26 | 140 | 58% | 24% | 19% | |
| 2012 | 77 | 49 | 20 | 146 | 53% | 34% | 14% |
As far as I can see, never in the past twelve years of data has any year approached Senator Liu’s number. Whatever comes of Senator Liu’s legistration, we should make sure that incomplete data don’t lead to bad statistics used to justify bad policy enshrined in unhelpful laws.
